

Logs
Runs and traces
Explore an execution and inspect its model requests, tool calls and recorded data.
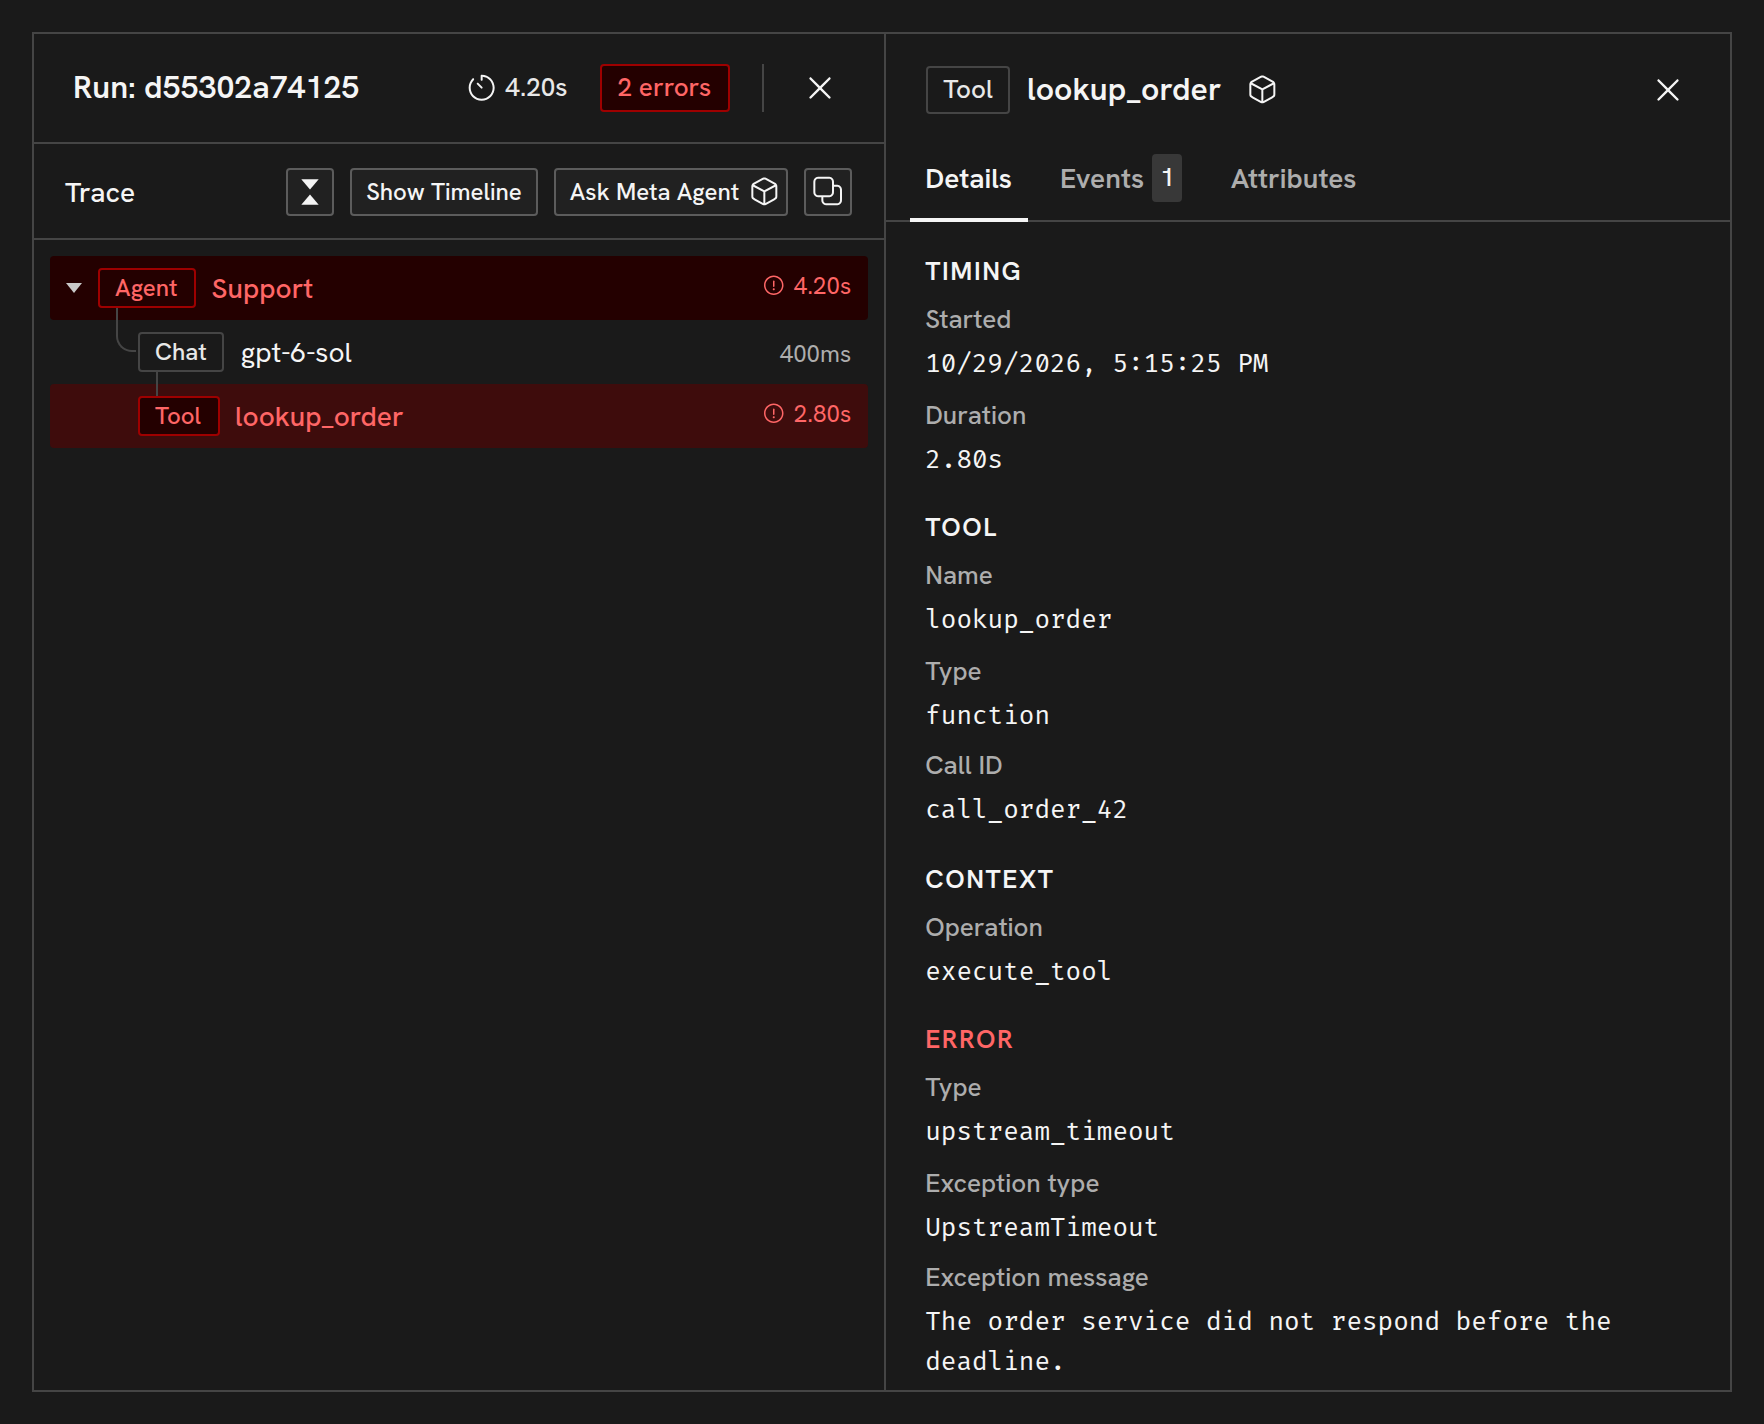
The execution view brings an agent’s operations and their recorded data into one workspace. Its hierarchy shows which agent, model or tool operation called another; selecting an operation opens its details alongside that hierarchy.
In Logs, select a row in All agent runs to open an invocation with its model requests and tool calls. In All traces, selecting an operation opens that operation and its descendants.
One run covers one agent invocation, including its model requests, tool calls and retries. Further user turns can start new runs in the same conversation. Use Conversations to inspect those runs together.
Inspect an operation
Section titled “Inspect an operation”The selected operation’s Details tab summarizes its timing, model usage, context and recorded errors. The available sections depend on the operation. Attributes contains its recorded attributes, including application-specific fields and structured payloads.
For prompts, responses and tool calls inside a model exchange, open Thread. For timestamped annotations or captured inputs and outputs, see Events and inspection. These tabs appear when the selected operation contains the corresponding data.
Show timing and usage
Section titled “Show timing and usage”Choose Show Timeline in the execution pane to display values beside the operation hierarchy. Switch the timeline between Duration, Token Usage and Cost (USD). Expanding or collapsing an operation updates the tree and timeline together.
Usage can be reported on an operation or aggregated from its children. The telemetry reference explains how nested agents and already-aggregated values are handled.
A run’s outcome is derived from its agent-invocation span. A handled error in a child operation does not, by itself, mark the run as failed.
Continue an investigation
Section titled “Continue an investigation”Use Ask Meta Agent on the execution or selected operation to ask a question with that activity as context. Its answer links back to the records it used.
To follow connections between operations within a trace or across grouped activity, open Trajectory View.
Copyright © 2026, Radiant AI Limited.